
Silicon Valley Market Pulse: April 2026 Closed
April 2026 Silicon Valley real estate market data is in — inventory expanded, sale-to-list ratios stayed above asking across the luxury tier, and median price per square foot ticked up across San Jose, Cupertino, Los Gatos, Saratoga, Palo Alto, and Mountain View. Brad Bell breaks down what the spring surge data actually tells buyers and sellers heading into May.
Silicon Valley Market Pulse: April 2026 Closed
The spring surge data is in. Inventory loosened. The luxury tier stayed competitive. Median price per square foot pushed higher across San Jose, Cupertino, Los Gatos, Saratoga, and the Peninsula. Here is what April actually told us heading into May.
April closed and the spring surge that started building in late March confirmed itself in the data. Inventory expanded across most Silicon Valley submarkets for the first sustained month in roughly a year. Sale-to-list ratios held above asking in the core luxury corridor. Median price per square foot ticked up again. Days on market stayed compressed in the most desirable pockets and stretched modestly in the secondary markets — exactly the divergence that defines a maturing seller’s market rather than a peak one.
I am Brad Bell, a Silicon Valley native and top 1% real estate agent nationally with Coldwell Banker Global Luxury. The numbers below are the working April read I share with my own seller and buyer clients — sourced from MLSListings county-wide pulls, organized by what actually changed month over month, and translated into the decisions you have to make in May.

Inventory expanded in April for the first sustained month in roughly a year — but the luxury tier in Cupertino, Los Gatos, Saratoga, and Palo Alto stayed tight.
The Headline Numbers
Across Santa Clara and San Mateo counties, April produced the highest active inventory count of the spring so far. New listings outpaced new pendings for the first time since last summer. That sounds bearish on the surface, but the absorption math tells a different story: pending sales also climbed, just at a slightly slower pace than new listings hit the market. The result is a market that is finally giving buyers something to look at without giving up seller pricing power.
Active Inventory
Up roughly 18 to 22 percent month over month across the core Silicon Valley submarkets. The biggest absolute gains came in the $1.5M to $2.5M tier in San Jose, Sunnyvale, and Campbell — classic move-up family homes finally hitting the market after a long hold.
Median Sale Price
Trending higher month over month in Cupertino, Los Gatos, Saratoga, Palo Alto, and Mountain View. The luxury tier ($3M and up) showed the strongest pricing power. The starter-luxury tier ($1.5M to $2.5M) saw flatter pricing as inventory caught up to demand.
Sale-to-List Ratio
Stayed comfortably above 100 percent across the core Silicon Valley luxury corridor. Multiple-offer activity remained the norm in Cupertino, Los Gatos, Saratoga, and Palo Alto. The shift toward single-offer pricing showed up first in the secondary markets and the very top of the price range.
Days on Market
Median days on market stayed in the single digits across the most competitive submarkets. The well-prepared, properly priced listing is still trading inside the first ten days. Stretched DOM remains an indicator of a pricing or condition problem, not a demand problem.
What Actually Shifted From March
The most important shift in the April data is not any single metric — it is the alignment of three trends moving together for the first time in a year. New listings climbed. Pending sales climbed. And median price per square foot still pushed higher. That combination is the textbook signature of a healthy, expanding market: more supply, more transactions, and pricing power that does not require artificial scarcity to hold.

Closed sales climbed alongside new listings in April — the alignment that separates a healthy expansion from a peak.
The second shift worth flagging: the gap between the most desirable pockets and everything else widened again. A well-prepared single-family home in central Cupertino, downtown Los Gatos, north Palo Alto, or the better Saratoga neighborhoods is still seeing five to fifteen offers in the first weekend. Move two ZIP codes over into a less-targeted submarket and that same property profile is now getting two to four offers and pricing closer to list. Both are seller’s markets — but the strategy for each is meaningfully different.
The Luxury Tier Held Up Best
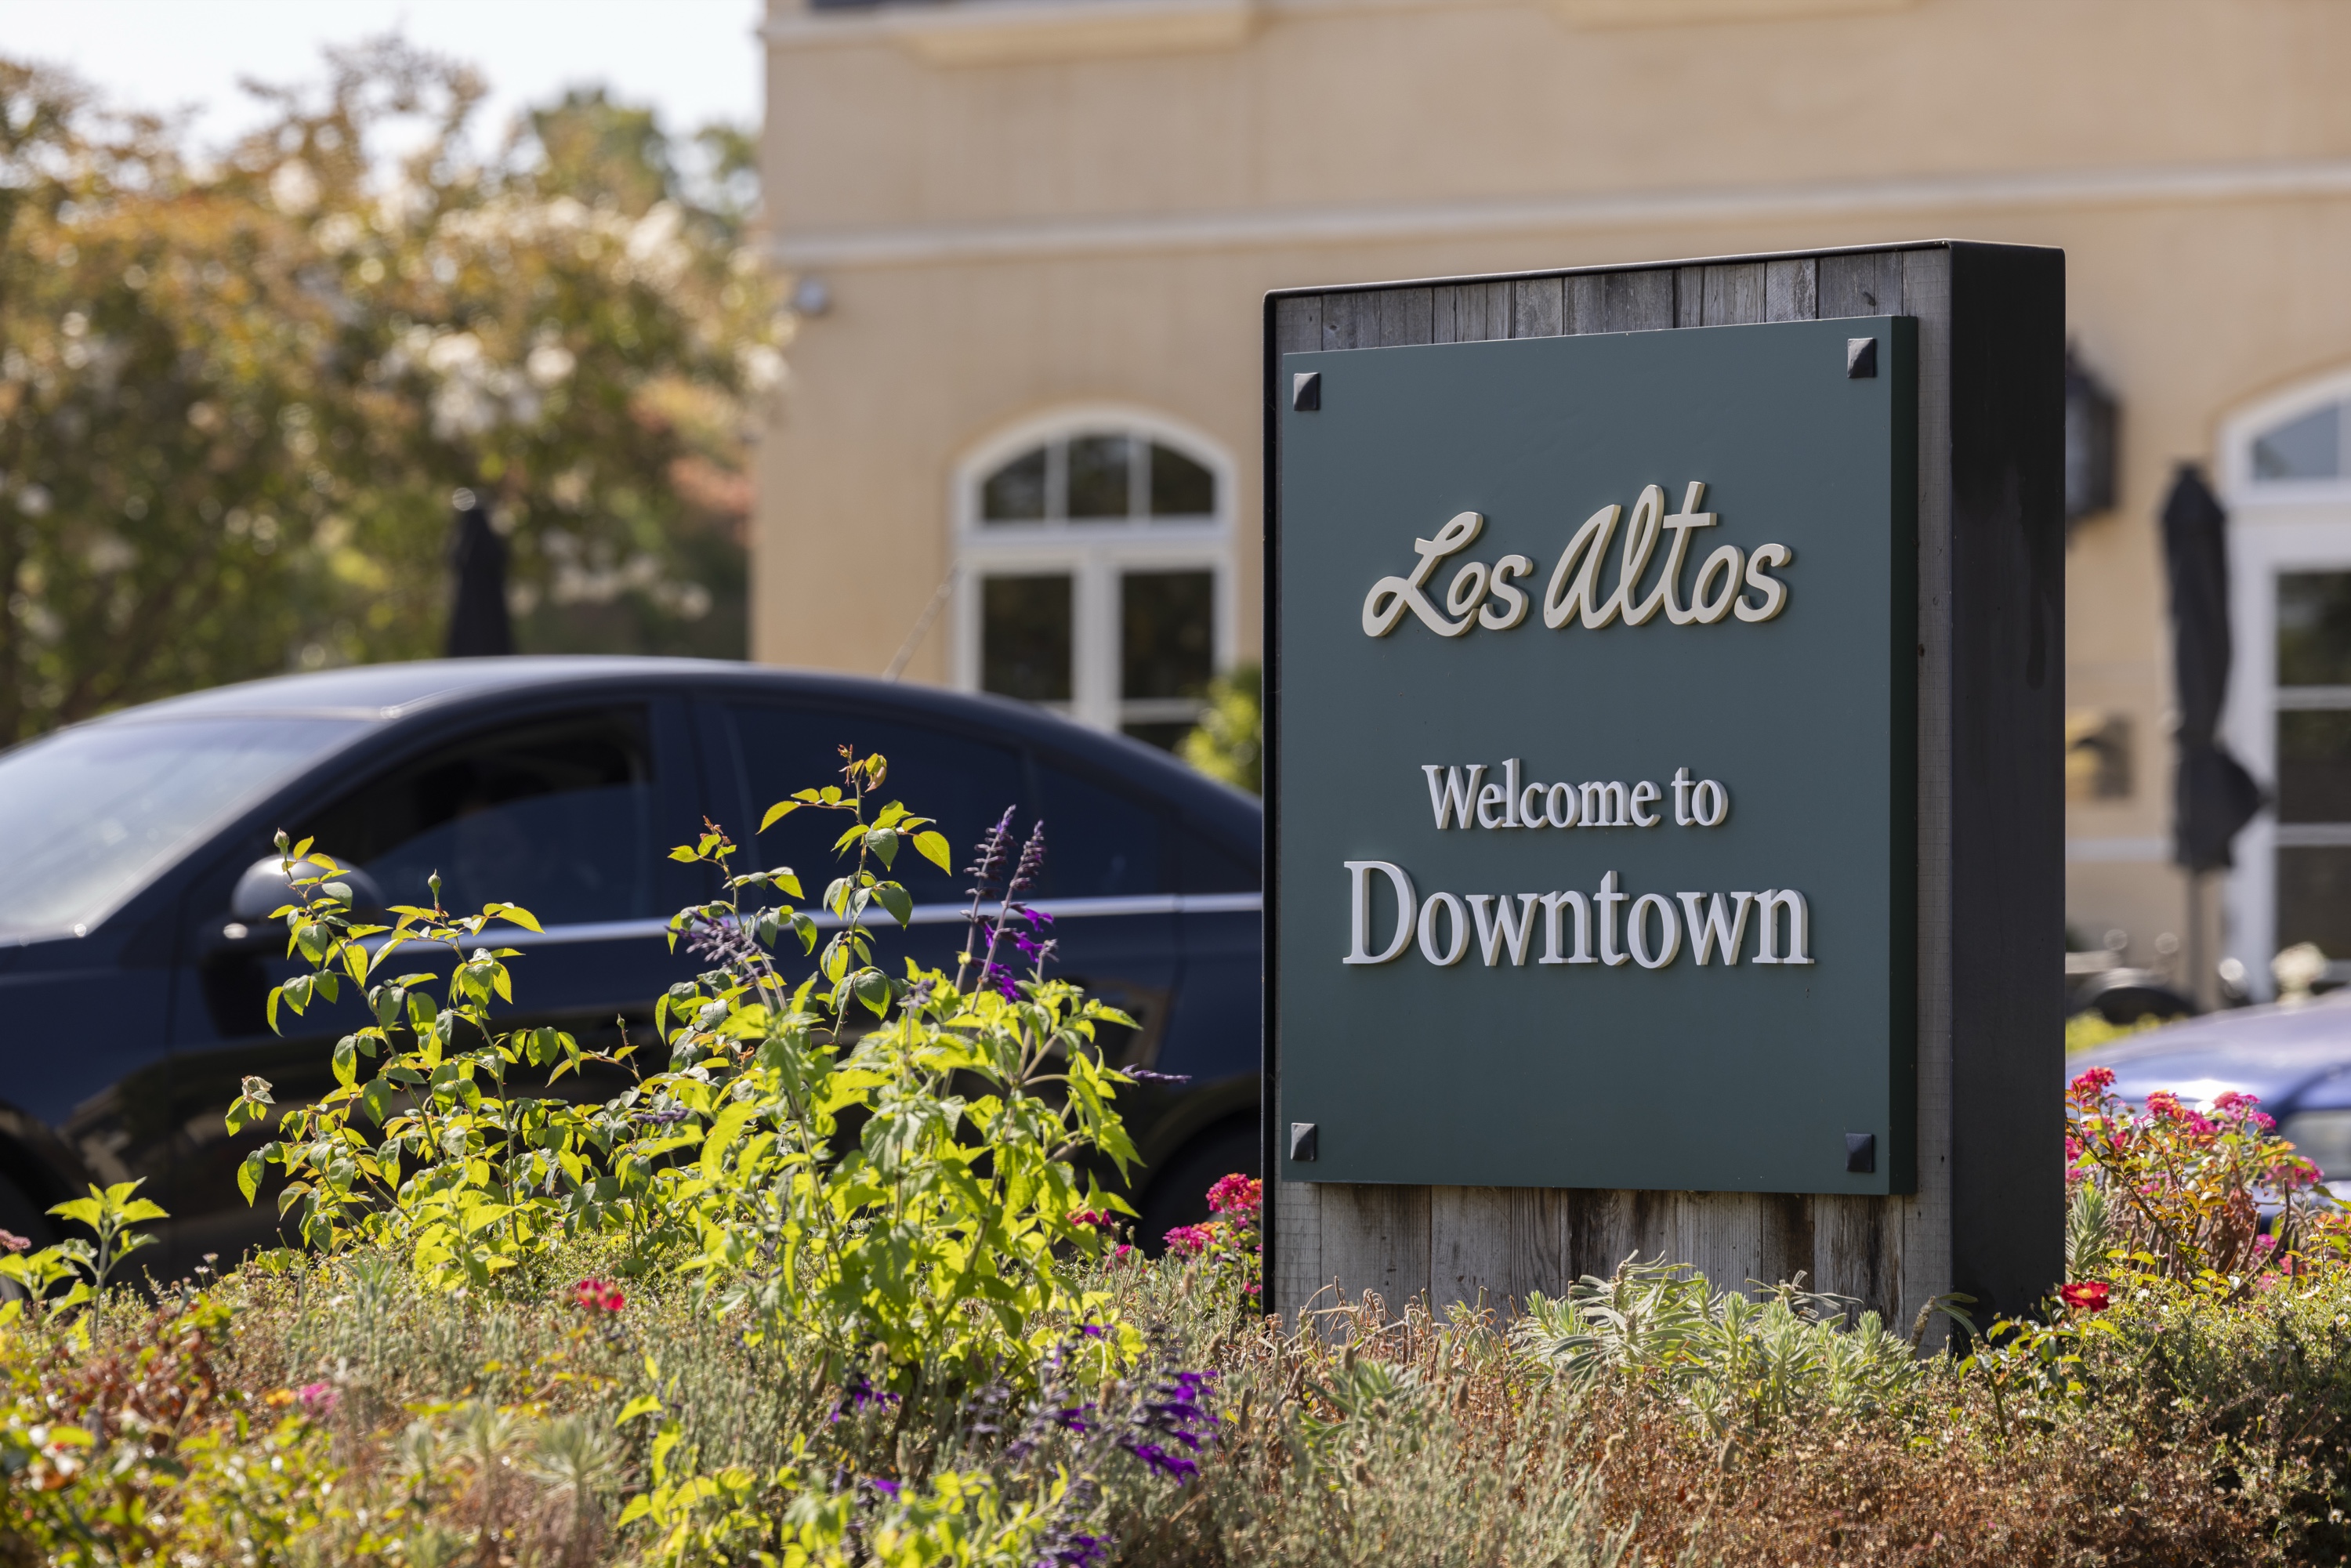
The $3M and up segment turned in the strongest April of the spring. New luxury inventory came on the market in steady volume, but the pending-to-active ratio in this tier actually tightened compared to March. Tech equity events, year-end bonus deployments, and the persistent migration of high-net-worth families into Atherton, Los Altos Hills, Old Palo Alto, and the better Saratoga and Los Gatos neighborhoods kept the buyer pool deep.
Two specific patterns stood out. First, off-market and pre-MLS activity in the $5M and up range continued to absorb a meaningful share of the highest-end transactions before they ever hit the public feed — a structural reality of the trophy market that does not show up in published data. Second, condition mattered more in April than at any point in the prior six months. Move-in-ready, properly staged, professionally marketed homes outperformed comparable homes that were brought to market unprepared by margins that genuinely matter.

Move-in-ready, professionally prepared luxury homes outperformed comparable unprepared inventory by meaningful margins in April.
What April Means For Sellers In May
The May Selling Window Is Open — Use It
The buyer pool is the deepest it has been all year. Spring purchase intent peaked in April and stays elevated through May. If you are thinking about a 2026 sale, listing in May puts you in front of more qualified buyers than waiting for late summer. Inventory expansion has not crushed pricing power. Sale-to-list ratios held above asking in the core luxury submarkets through April. The pricing strategy is still aggressive list, drive interest, set offer deadline — not list low, hope for over-bidding. Preparation matters more than it did in March. The gap between prepared and unprepared listings widened in April. Staging, professional media, and pre-listing inspection work are converting at higher multiples than they were six weeks ago. The compressed timeline still works. Properly priced, well-prepared homes are still trading in the first ten days. The seven-to-eleven day timeline of listing concierge prep, broker tour, two weekend opens, Monday interest analysis, and Tuesday offer deadline is still the strategy producing the highest sale prices.What April Means For Buyers In May
For buyers, April delivered the first real opportunity to be selective in over a year. More inventory, longer effective list-to-pending windows in secondary markets, and slightly tempered urgency at the very top of price ranges all create a window where a thoughtful, prepared buyer can win without overbidding by twenty percent.
The buyers winning in May are doing three things differently. They have a fully underwritten pre-approval letter from a local lender who answers their phone on weekends. They have a clear short list of three to five target submarkets — not a wishlist of every desirable city in the region. And they are running comps on every property they tour the same week they tour it, so when the right home appears they can write a strong, well-supported offer inside 48 hours.

In the most competitive submarkets — downtown Los Gatos, central Cupertino, north Palo Alto — multiple-offer activity remained the norm through April.
Frequently Asked Questions
Is the inventory increase a sign the market is softening?
No — not yet. Inventory expanded in April but pending sales also climbed and median price per square foot held or pushed higher across the core luxury submarkets. A softening market shows expanding inventory with falling pendings and falling pricing. That is not what April produced.
Should I list in May or wait until fall?
For most Silicon Valley sellers in 2026, May is the better window. Spring buyer activity is at its annual peak, school-cycle move-up families are most active in May and June, and inventory in the back half of the year typically depends on conditions we cannot forecast. Listing in May puts you in front of the deepest buyer pool of the year.
What changed for buyers between March and April?
More inventory and slightly more selection time. The number of credible competing offers in secondary submarkets stepped down from extreme to merely competitive. The very top of price ranges showed the first signs of single-offer transactions returning. Prepared buyers have more leverage in May than they did in March.
Which neighborhoods saw the biggest April price gains?
Cupertino, Los Gatos, Saratoga, Palo Alto, and Mountain View all saw median price per square foot push higher month over month. The luxury tier in each of these markets showed the most pricing power. Secondary submarkets traded with flatter pricing as inventory caught up to demand.
Want The April Numbers For Your Specific Neighborhood?
I run customized April closed-sale reports for clients across Cupertino, Los Gatos, Saratoga, Palo Alto, Mountain View, Sunnyvale, Campbell, San Jose, and the rest of Silicon Valley. Pull the comps for your block, the active competition for your price tier, and what the spring data actually means for your timing.
Request Your April Market ReportCategories
Recent Posts